Mobile charts for participant progress
Create Mobile Charts that Show Participant Progress over Time
When conducting your experience sampling method (ESM) and ecological momentary assessment (EMA) project, you may want to create mobile charts for participants to view at any time throughout the study period. The charts display data that participants have entered over time. In other words, it shows participants their own responses over time in a graph or chart in the ExpiWell mobile app. You can specify the axes and type of chart participants can see.
The mobile charts are especially useful in the following scenarios:
-
Participants to track their progress over time
-
Participants to learn about their own trajectory
-
Ecological momentary interventions (EMIs) where self-knowledge is helpful
The following steps show how to create mobile charts that participants can view throughout their experience:
Step 1: Create your questions, and toggle 'Score' on those questions you would like to chart. The scoring will appear on the right side of the choices.
Note: Only questions with scoring enabled can be used for the chart options.
You can also REVERSE the scoring for your question.
Step 2: Click the “Feedback” button in the survey builder.
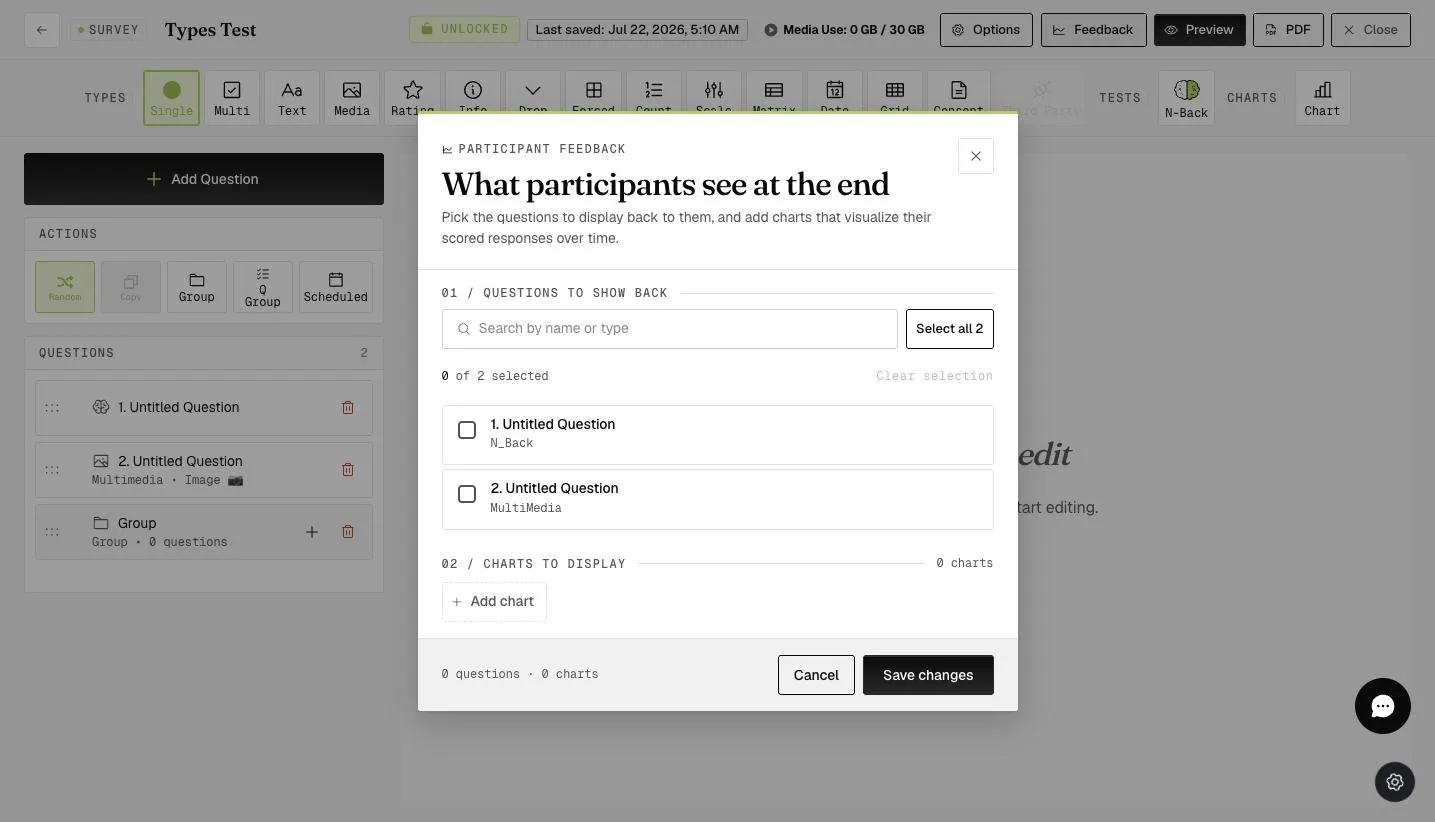
Step 3: Click the "Add chart" option. You can title the chart and choose the number of days and the range of values. Choose whether you want the chart to display the mean (i.e., average score) or the sum (i.e., total score). Select the scored questions you would like to include in this chart. Click 'Create chart', and you are all set. The chart will appear on your participant's mobile app.
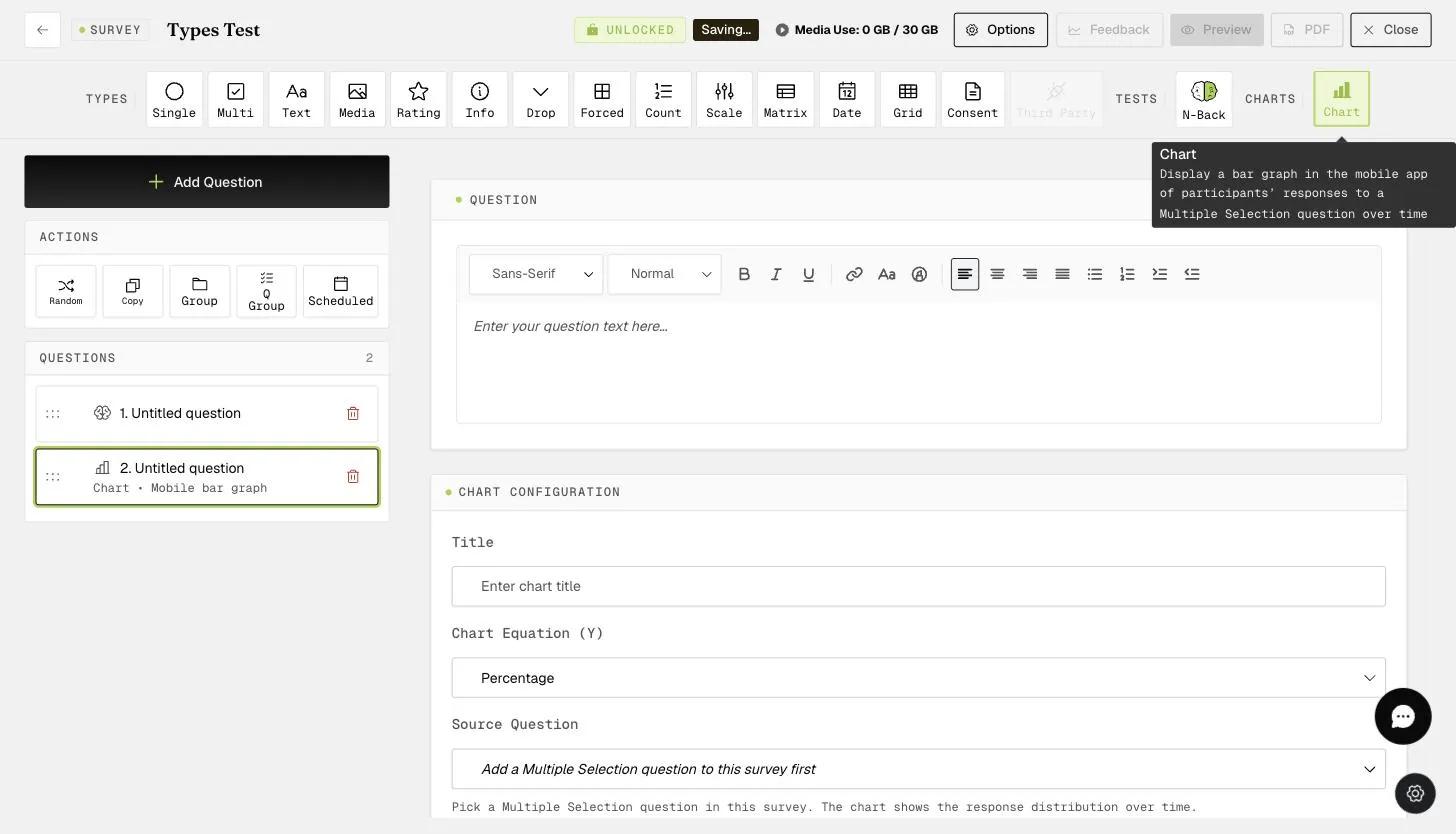
You can choose to add more charts or exit the survey builder to continue with the rest of your project setup.
In the ExpiWell mobile app, you can check for the chart after answering the survey.
Click the 3 DOTS on the right side of the survey, and click 'Show Charts'.
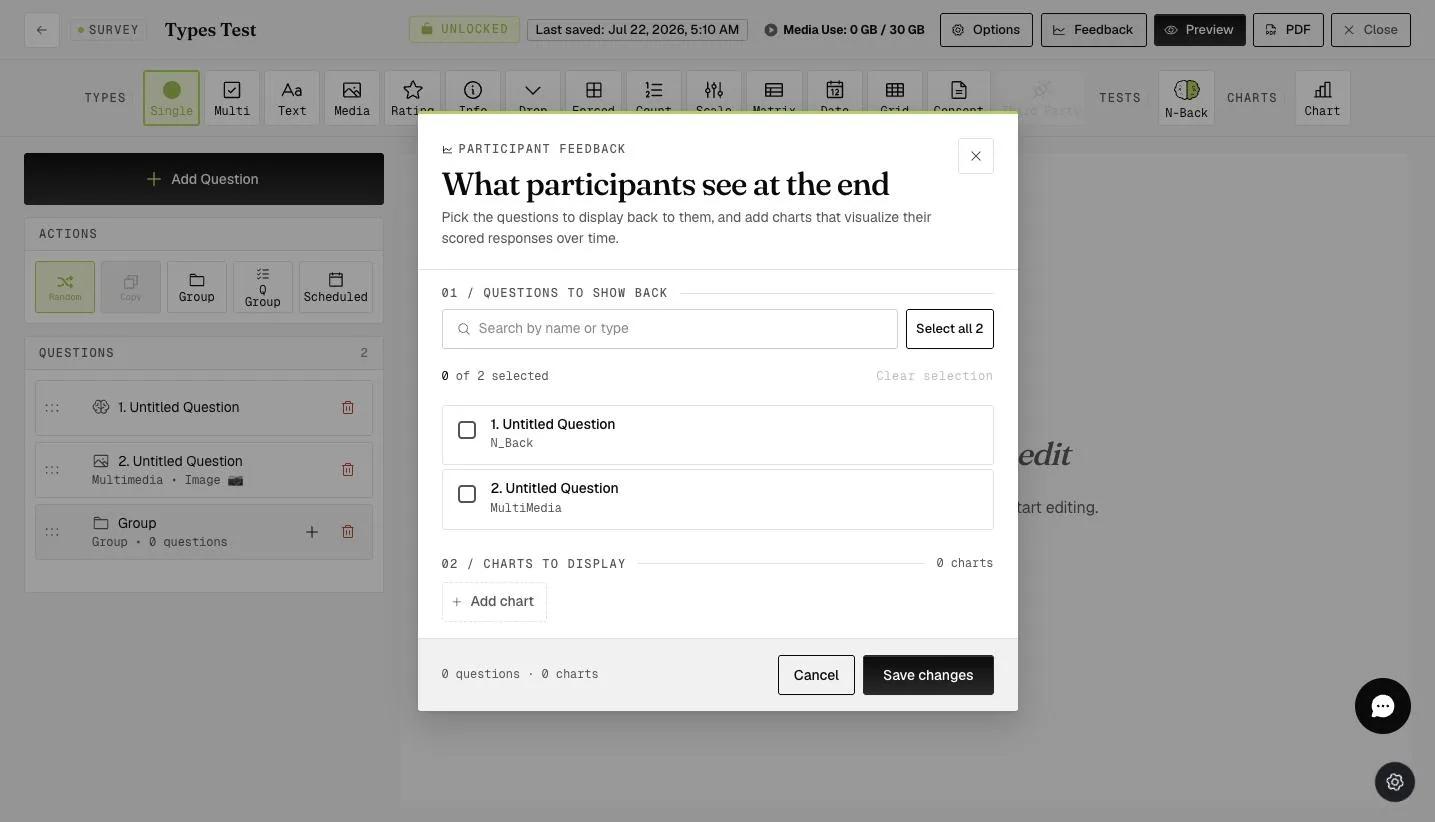
The chart(s) you set up will appear, and participants/respondents can track their progress.